
AUTOMATION BASED
ONLINE TRADEROOM
FOR MULTI MARKET & MULTI TIME FRAME STRUCTURAL ALGORITHMIC TRADING

WHAT WE DO
We provide an integrated Structural Trading Solution for traders utilizing a proprietary, Structural Algorithmic fully Automated Trading System. The System is designed to work equally well in any Market. Its Strategies analyze and trade any given Stock and ETF, any given Commodity, any Index in any desired Time Frame in any given Market.
Samples below offer a glimpse of trading signals generated by the System and its Strategies over the years in various trading environments (Equity and ETF Markets, Futures Markets and Commodities Markets) as well as their respective pertinent Time Frames (Short – 5 min, 2 min, 1 min; Intermediate – 120 min, 60 min, 25 min; and Large – Weekly, Daily and combination thereof). The Strategies are versatile and robust enough to enable a trader to engage and exercise Positional (Long Term, Intermediate Term, Short Term) and Profit defined trades (Long Term, Intermediate Term, Short Term) within any desirable trading context defined by any specific financial instrument and a chosen Time Frame(s).
ETF
EQUITY
INDICIES
COMMODITIES


WHAT WE OFFER
-
Access to the Online Trading Room which demonstrates live Buy and Sell signals on selected types of Markets and Time Frames based on our fully Automated Strategies custom tailored to your specific requests.
Long, Intermediate and Short term Trend definitions within the context of any and all requested Time Frames.
Long, Intermediate and Short term trades - both Positional and Profit Defined (including Multi Positional, “Scalping” and various combinations thereof).
Static and Dynamic Risk Management; Order Placement and Execution.
-
Full Analytical, Structural Assessments and Packages for any Stock, ETF, Index or Commodity.
-
Design and/or calibration of Trading Methodologies and Trading Plans specific to your financial resources and capabilities, risk tolerance, time horizons, profit objectives and trading acumen.
-
Assistance in determining Strategies exclusively designed for Day Trading and/or Strategies designed for Overnight, Short, Intermediary and Long term trading for both Positional and Profit Defined trades.
-
A valid Hedge Mechanism, consisting of independent but correlated Strategies, of being Short and Long simultaneously through a concurrent exposure to different Time Frames within the same Market, as well as Hedging among concurrent Trends within a single Time Frame.
-
Synchronization of correlated Time Frames; Synchronization within a singular Trading Time Frame of concurrent Trends.
-
Capability, through Structural Framework, to analyze and trade extensive range of Financial Markets and Instruments with minimal expenditure of time and effort.
-
Ability to function and potentially perform well within a particular Time Frame, as well as within Multiple Times Frame for specific Markets - an essential ingredient of a more comprehensive Trading Plan.
FOR
BEGINNERS
An ideal introduction to the world of trading and the freedom that successful trading brings to all different aspects of one's life:
An insight into inner workings of the Market - its structure, elegance, order and predictability.
-
Familiarity with the practical applications of Technical Analysis; understanding of working with Multiple Time Frames; working with Positional and Profit Defined trades; Correlation and Synchronization of Day and Night sessions; working with Multiple Trends within the same Time Frame and among Correlated Time Frames of the same Market in order to diversify your Risk and Hedge your Market Exposure; working with integrated Risk Management and real time generated Buy and Sell signals.
-
Ability to try out different ways - whether through Day Trading Strategies, Overnight Strategies or Strategies designed specifically for longer terms, depending on your level of comfort and objectives of participating in the Markets with a hands on practical application utilizing a Structural approach and the Methodology applicable to a wide range of Financial Markets and their respective Instruments.
-
Understanding the importance of having your own Trading Methodology and Trading Plan designed and adjusted to your own exclusive needs, in order to maximize chance of success in trading.
-
A chance to begin incorporating and implementing your own ideas into a coherent, viable and hopefully quite profitable Trading Methodology and Trading Plan.
-
Opportunity to follow a fully integrated Analytical and Structural Methodology on simulation in order to gain invaluable trading experience and confidence to trade with real funds.
DAYTRADING


Positional and Profit Defined Multiples.

Positional, Positional Multiples and Profit Defined Multiples.


Positional Multiples and Profit Defined 1 and 3 points
POSITIONAL / PROFIT DEFINED


Positional

Positional


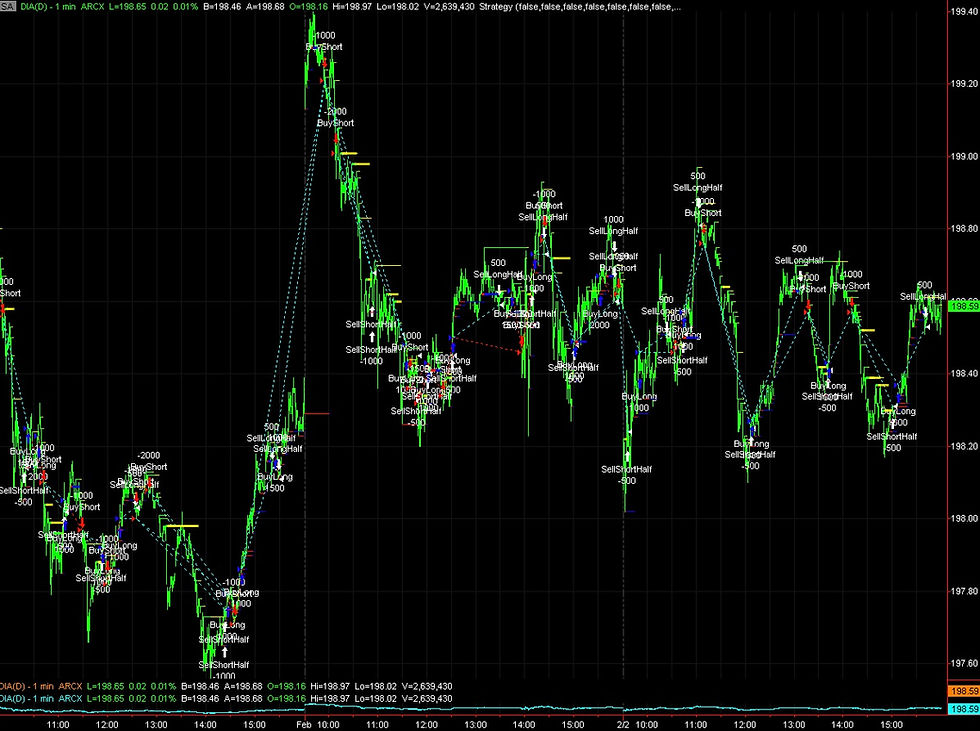
MULTIPLE TIMEFRAMES

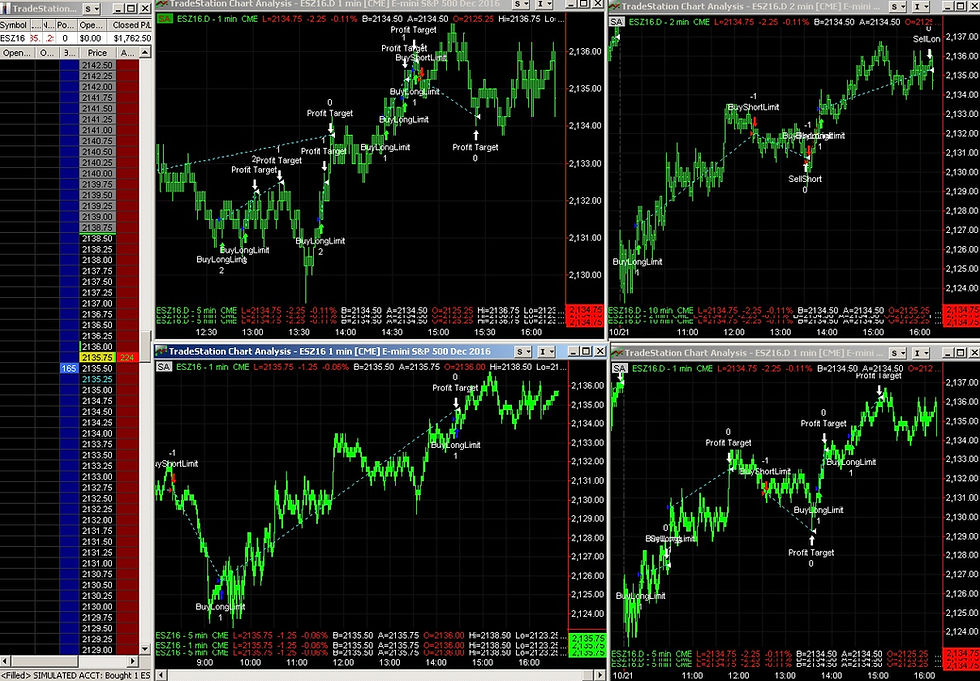
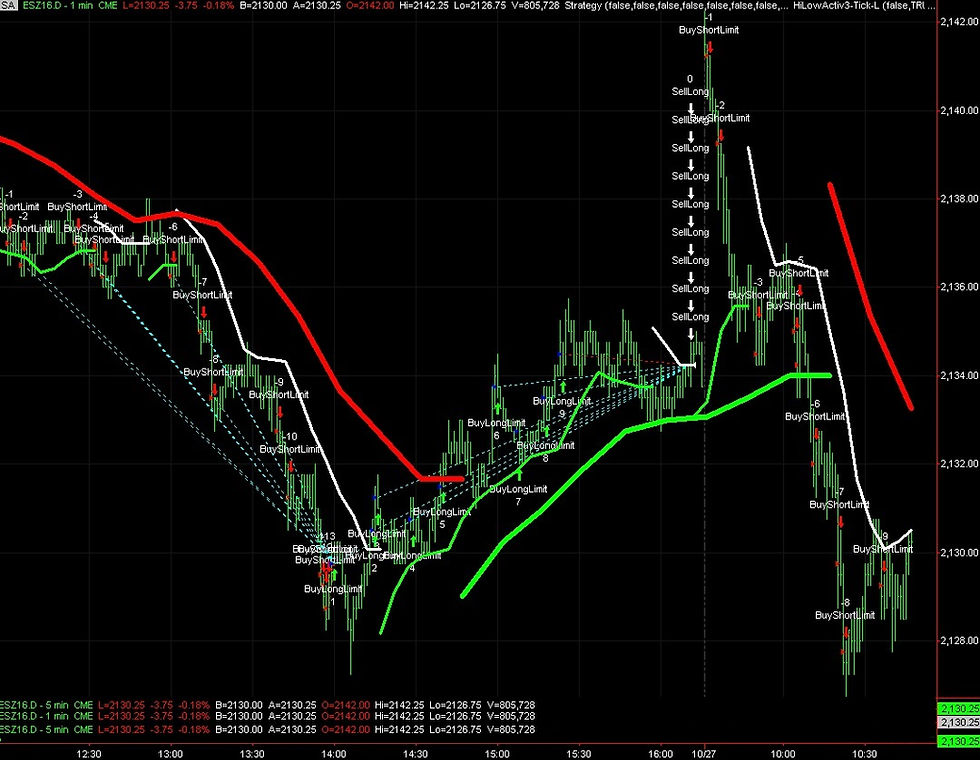
1min 5min Profit Defined Multiples and ESD E-mini futures (Day) 1min 5min Positional.

1min 5min Profit Defined Multiples.
1min 5min 2min 10min Profit Defined and Positional.

1min 5min Positional Multiples.

1min 5min Positional Multiples.

1min 5min Positional.

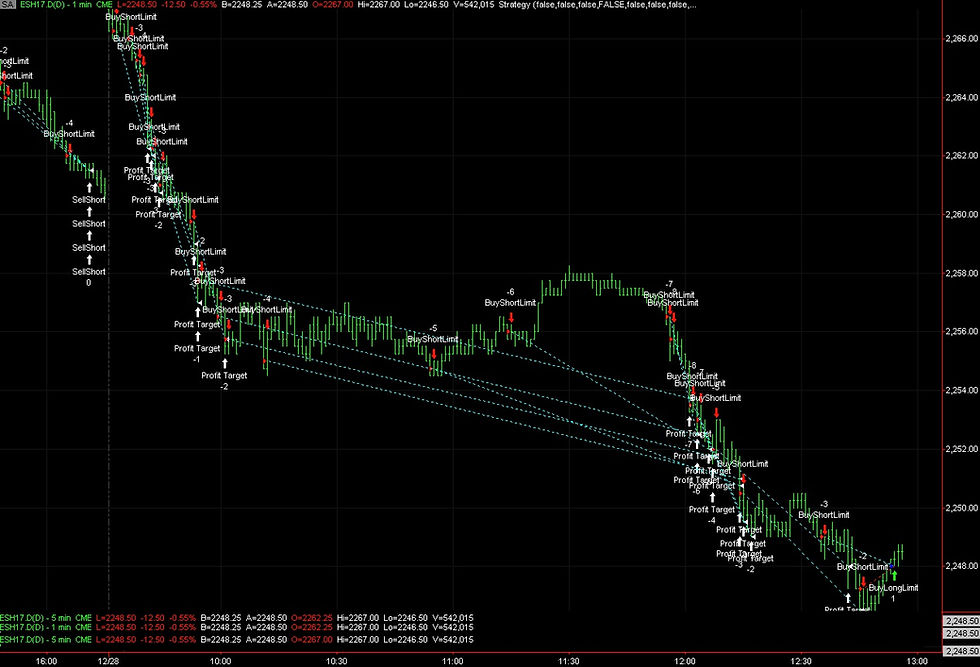
1min 5min Profit Defined 3 points vs Positional Multiples.

1min 5min Profit Defined 3 points vs Positional.

1min 5min Profit Defined Multiples 1 point.

1min 5min Profit Defined Multiples 1 point.

1min 5min Profit Defined Multiples 3 points vs Positional Multiples.

1min 5min Profit Defined Multiples 3 points vs Positional.

1min 5min Profit Defined Multiples 4 points.
1min 5min Profit Defined Multiples 4 points.

1min 5min Profit Defined Multiples 5 points and Positional Multiples.
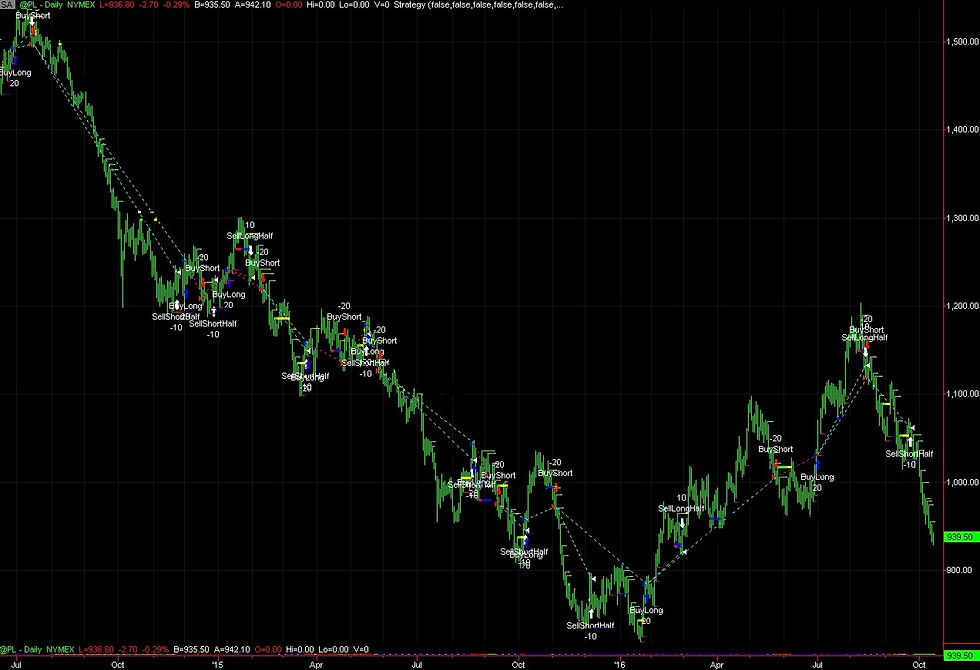
5min 15min Positional Multiples.
FOR
PROFESSIONALS
“Fortes fortuna adiuvat” – an unexpected possibility of seeing missing pieces of the puzzle.
-
Fully integrated Analytical and Structural Packages for any Market of interest:
Analytical Package includes a thorough analysis of a specific Market of interest you request. Determination and subsequent decomposition of a particular Tradable Time Frame (TTF) you will engage in, into its corresponding Structural Trends and establishing Structural relationships among them within a Multi Tier Hierarchical Framework. Synchronization of a TTF with TF of a higher order, if any. Synchronization and Hedging of concurrent Trends within each TTF. Unequivocal definition of the beginning and the end of Retracements and Corrections within each aforementioned Trends, identification for respective Trends, Positional and/or Profit Defined entries and/or Multi Positional re entries within a specific TTF. Determination of major areas of Support and Resistance for each existing Trend, Fib levels for each concurrent Trend within a TTF, as well as correlated TFs if needed. Price targets where Trends and thus positions might change for each TF under consideration. Risk Analysis and Risk Management based on your particular risk tolerance, risk parameters and financial allocation for a singular Market. Selection of Positional and/or Profit Defined trades, including number of contracts to be employed, optimal values for Static and Dynamic stop losses, trading time horizons, selection of either Day Trading and/or overnight exposure.
Structural Package implies calibration of the appropriate existing Strategies in order to closely reflect your unique Analytical Package. Once they are calibrated you will be able to see the Strategy and generate buy and sell signals in real time as recommended by your Analytical Package TTF.
Custom designed Hedging and Synchronization Strategies based on a singular TF or juxtaposition of correlated Time Frames within the same Market, utilizing an appropriate to your objectives financial instrument or a combination thereof. Such Hedging and Synchronization Strategies will result in partial reduction or elimination of unnecessary allocation of principal capital used to take a symmetrical position in the Markets due to the increased volatility or an accentuation of an unknown, in order to Hedge your current asymmetrical exposure. The result - committing and putting a hundred percent of your capital to work instead of dissipating a substantial portion of it to procure unnecessary insurance.
-
Design, Testing and Implementation of a fully functional Stategy, specifically custom tailored to your trading needs and objectives and a fully Automated Trading Strategy based on a proprietary and totally unique in house designed Algorithm (for a more comprehensive insight into our Methodology please reference the "White Paper"):
The Algorithm provides an unconventional approach to perceiving and working with the Market. We approach any Market and any and each pertinent Tradable Time Frame as a self contained, perpetual, Dynamic, Multidimensional, and Multi Trending Structural construct. The Algorithm enables one to see and to work with the continuum of the Market as a dynamic, ever changing amalgamation of ephemeral Hierarchical Structures embedded within a Multi Tier Hierarchical Framework and their corresponding, coexisting and interdependent multiple Structural and Fractal Trends. At any time it identifies and maintains several concurrent Trends and their Structural and Hierarchical relationships, as well as the predictive causality such relationships entail, within one integrated and continuous trading environment. Such an approach resolves pretty much all of the issues effecting a trader such as Drawdowns, Volatility, Fibonacci Retracements, ambiguity, dangerous relativity of Supports and Resistances, False Breakouts, Divergences and Convergences, Retracements and Corrections, as well as, the deceptive causality of such prevalent technical patterns as Flags, Triangles and such. It also completely negates the need for any theoretically feasible but rather impractical applications such as Elliot Wave theory, a myriad of ubiquitous indicators like Volume, Momentum, Moving Averages or any other tools most traders use - all the bricks that build the modern Technical Analysis. The Algorithm accomplishes that by exploring and exploiting a build in dynamic processes of Synchronization and Hedging as the derivatives of the Multidimensional Hierarchical Framework which sustain the Markets' own natural dynamic and are internal to it. Thus, the Algorithm eliminates the need for ever searched after Quantitative models and the need for conventional Hedging that utilizes a contrived symmetrical market exposure to mitigate the risk. Such quests become obsolete since the Market itself, through its own Structural Framework, provides a natural build in dynamic mechanisms and processes that by their innate functionality eliminate the need to seek external, artificial solutions which Market solves naturally as an inherent function of its own construct and dynamic.
As a result, we can provide you with a totally unobstructed, devoid of any external noise and pollutants, view of the Market from within its Structural, its Multidimensional self. We enable you to work with the cause and not the effect. At any moment, you will know what the Market is doing, and most importantly, why. The Market offers us a toolbox to fix any practical issues, conundrums and to deal with them quite effectively; we merely have found the key. Based on our proprietary Algorithm we are able to design, implement and calibrate the Rules and the Logic Engine for any conceivable trading plan and objective.
As can be deduced from the above this is an extremely exclusive and confidential endeavor for a very limited number of Clients. Each will have codified, one of kind, Business Logic, Profit and Strategic Objectives as well as a set of Parameters so that no other Strategy will compete with same kind in the Markets, thus potentially reducing its profitability.
We offer you a new Technology to extract and to harness the full potential of the Markets. To approach the aforementioned claims with a healthy dose of skepticism is to be expected; to dismiss the aforementioned outright, without proper verification and validation, is to do so at your own peril. Your competition might not.
SYNCHRONIZATION OF TIME FRAMES
SAMPLE 1
SAMPLE 2
SAMPLE 3
SAMPLE 4

first, Strategy is set to define only one Structural Primary Trend. Please keep in mind what you see here is only a one dimensional view into a Multidimensional Construct. Out of several Structural and Fractal Trends permeating a Market Structure at any given time, this chart depicts only one. Through their interaction such Trends provide Synchronization and Hedging Mechanisms that deal effectively with all ebb and flow of the Market.
second, Strategy is set to find and to Synchronize a Long term Trend with specific optimal entry points in the direction of the Structural Primary Trend only. Here you see another dimension coexisting within a Hierarchical Multidimensional Multi Trending Framework. The Trends seen on this chart are the derivative Trends of Encapsulated Structures within a higher Structural Tier of which the Primary Trend they Synchronize with is a part of.

once any Structural Primary Trend is determined, we can drill down and determine Retracements, Corrections and points of entry, and/or reentry, within such a Trend using the same TTF or LTF.

here Strategy is set to Synchronize Retracements with the pertinent Primary Trend (four of them seen here).
while Trend is in effect we SellLong(Short)Half before the Retracement, while keeping the other half in a trade;

and liquidating the entire position once the Primary Trend has changed.

here is a sample where we Synchronize LTF (Daily) with a HTF (Weekly);

using LTF (Daily) as a TTF we Synchronize entry and reentry after Retracements with HTF (Weekly) to get a better price.

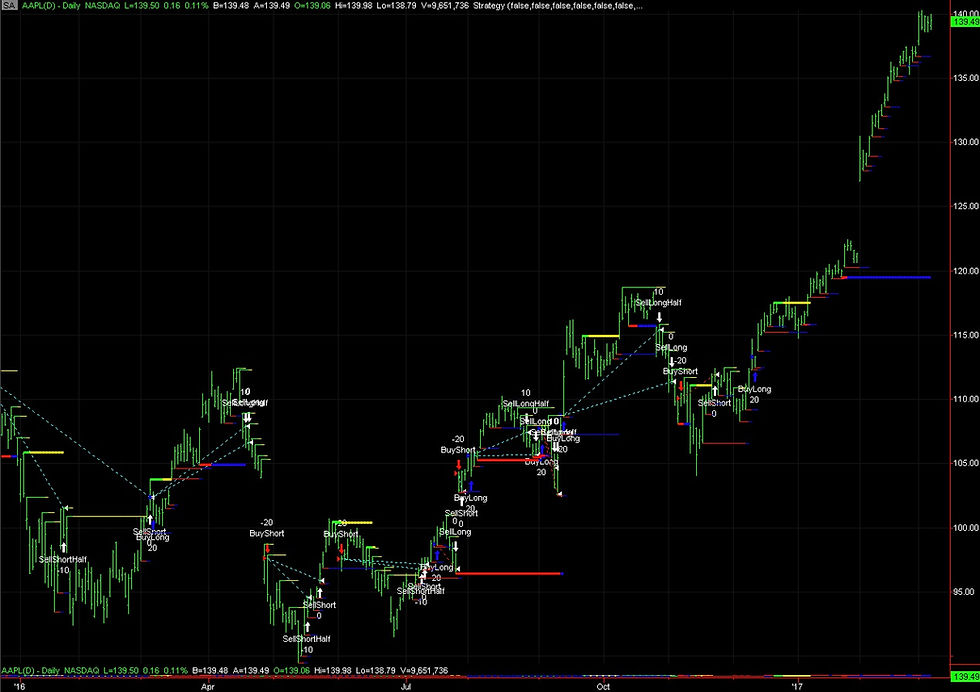
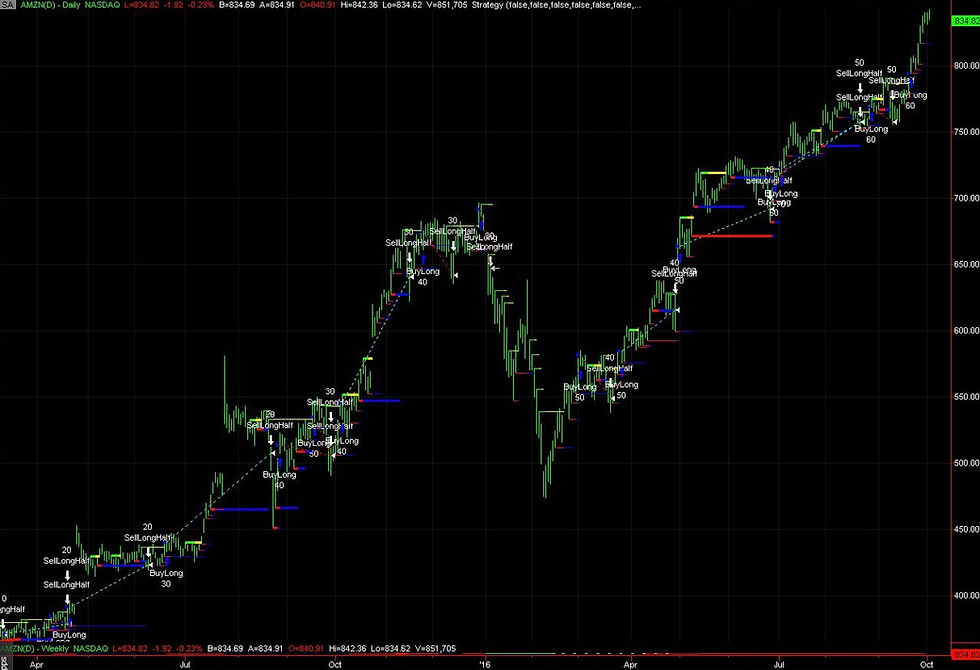
here is a sample of Daily TF identifying the Primary Trend Retracements and re entry points. Even though Strategy has liquidated the Trend at the bottom, last Retracement was identified and traded on at the very top of the market by SellLongHalf in Aug 2015.

identification of the Retracements re entry points and Synchronization with the Primary Trend.

even though the Long Trend was liquidated at the very bottom, Short Trend was never initiated and in early 2016 Long Primary Trend was reestablished and is current, with Positional Multiples being accumulated after each Retracement through Synchronization.
SAMPLE 5

while underlying Trend is Long, Strategy will identify and trade Retracements trying to get maximum price at the top and lowest price at the bottom.

until the Trend is over.
SAMPLE 8

Inversion, counter movement of price to the current Structural Primary Trend before Synchronization, is used to maximize profits;

by optimising exit and reentry points.
SAMPLE 9

sample of Synchronization for Long and Short Trends.

as a matter of practical application any SellLongHalf or SellShortHalf can be used as an independent signal to reverse a trade and go against the underlying Trend until reentry signal is given since it is just another Structural Trend within a Multi Structural Framework.
SAMPLE 7
here is the same example as in Sample 6 except Strategy is set not only to determine a Primary Trend but also to build Positional Multiples after Retracements using Synchronization of Encapsulated Hierarchical Structures.

using juxtaposition of HTF and LTF Strategy executes Synchronization; a depiction of only one Structural Trend within a Multi Trending context.

but now using only LTF we get even more precise and lucrative entry and reentry points.
SAMPLE 6

Strategy is set to define only the highest Hierarchical Structural Primary Trend on HTF (Weekly).
using HTFs (Weekly) Trend TTF (Daily) Strategy identifies and trades Retracements and Synchronizes with the HTF Trend as long as its intact.
SAMPLE 10

Strategy is using Synthetic TF to establish Primary Trends, to identify and trade Retracements within those Trends, and to Synchronize reentry in the direction of the same.

note that even though Long Trend ends a couple of times it never goes Short since 2010 (and even then only ever so briefly).

interestingly the Strategy did not identified a Retracement at the very top here but quite presciently terminated Primary Trend just before the drop - since we relying in this case on interplay of different TFs the HTF kept us from going Short, however using LTF alone would have gave a change of Trend to go Short as the next Sample illustrates.
SAMPLE 11
utilising HTF and LTF within a Synthetic Framework gives us a precious stability but at a price as is seen here; we are missing out on a signal to go Short.

working with a LTF exclusively, a Non Synthetic TF, solves the problem in half and fully when parameters are set to reflect a more aggressive Trading Objectives and Trading Plan as first sample in Hedging clearly shows.
SAMPLE 12

Primary Trend and Synchronization on a way up. Within a Multidimensional Structure we can see three distinct Structural Trends: Primary, one that defines the Retracements and one that provides Synchronization.

Primary Trend and Synchronization on a way down. Same three Structural Trends in reverse.

and what it looks like if all positions are liquidated at Retracements. A limited one dimensional view of Multidimensional Construct.
SAMPLE 13

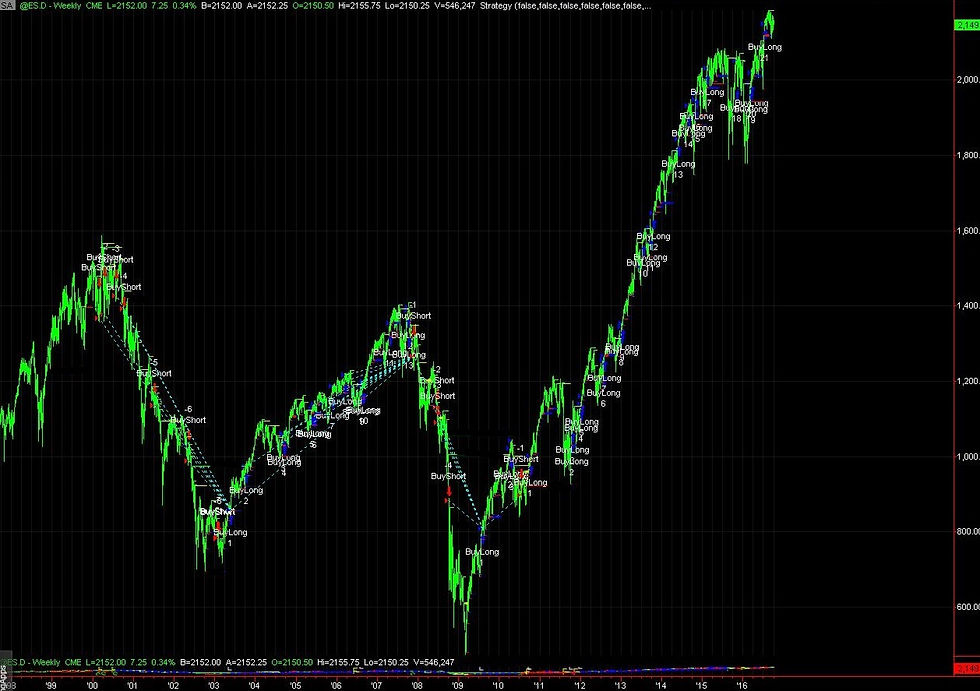
using Non Synthetic TF a multi year Structural Primary Trend is defined.

once the Primary Trend is known, we utilize the Synchronization or derivative Trends of Encapsulated Structures within a higher Hierarchical Tier that defines such Primary Trend to trade this Trend. Note when last Retracement is identified (the very last SellLongHalf on the chart), just before the notorious Black Monday of 1987.
HEDGING
SAMPLE 1

by definition once Primary Trend is defined we always trade in the direction of that Trend however, every Retracement presents a real danger of becoming a Correction or leaving us with a missed opportunity like is seen in this chart.

we Hedge the danger of a runaway pullback by trading the reverse price action, Inversion, as an independent Trend;

while keeping in mind the overall context of which such Hedge is a part of.
SAMPLE 2
SAMPLE 3
SAMPLE 4

while maintaining a Trend we sacrifice an opportunity in the end of 2015 beginning of 2016.

using a LTF as TTF, we Hedge any potential exposure.

here we see only one Primary Structural Trend within which other Structures and Trends will be Encapsulated. In August/October of 2016 the Market started to pullback;

using a Synthetic TF set up (5min/15min), we can Hedge our macro exposure by trading a multitude of TFs, or combination thereof, to capitalise on that Inversion as this and following charts show;
or with Non Synthetic TF (5min) achieve the same Hedge.

the degree of difference in TF is irrelevant, we can pair with Daily TF, even a 1min TF to achieve a successful Hedge.

if trading a specific TF, our position falters on 10/04 10/05 10/06;

trading a different TF of the same instrument might Hedge our losses elsewhere.

the aforementioned dates on a LTF (5min) provide an adequate Hedge.
SAMPLE 5
SAMPLE 6
SAMPLE 7
SAMPLE 8
SAMPLE 9

looking at the chart from a Structural angle, three Trends are implicit - a Primary Structural; one that identifies a Retracement and a Synchronized derivative Trend of an Encapsulated Hierarchical Tier. The Hedge here can also be done with the help of a LTF, next chart.

an effective Hedge to a HTF at times of Non Synchronization; middle of 2014 with both TF’s trading in tandem as two separate accounts providing Synchronization, a Hedge, Diversification and a mitigation of risk.

while the Primary Trend is in effect Strategy identifies Retracements and Synchronizes afterwards with its Encapsulator (Primary Trend of a Higher Structure) until Trend is terminated in September 2015, as well as after the Trend resumes again in early 2016.

Synchronization of the Trend.

at the same time Strategy can trade every Retracement as a separate Trend using a natural Hedge mechanism within a Multidimensional Framework;

here if we using Weekly as a TTF;

or merely as a stabilized long term Trend;

we can set up a LTF Daily to provide augmented Synchronization points with HTF;

here Strategy is set to trade only Synchronization after Retracement in the direction of the underlying Structural Trend; in order to Hedge our exposure to Primary Trend’s Inversion we can drill down the TF and use any LTF to trade an adverse price move.

using any LTF, here 5min; we Hedge our exposure to the ongoing or pending Retracement by using a Strategy set to trade each Retracement and Correction as an independent Trends, in effect trading other Encapsulated Primary Structural Trends within a Hierarchical Framework.

sample of a Hedge in reverse. When LTF stumbles, 9/29 - 10/01 wrong Short; the HTF, next chart, provides a Hedge before Trends Synchronize.

Hedging between TF’s is a two way street, accounting for a certain degree of Diversification in Multi Time Frame approach.
SAMPLE 10
SAMPLE 11
SAMPLE 12
SAMPLE 13
SAMPLE 14

while a couple of Retracements are in progress late July and late August;

a LTF provides an effective Hedge and a powerful Synchronization.

using a HTF to provide Trend stability, we forgo certain trading opportunity on LTF as a TTF in a Multi Time Frame chart - Strategy identifies a Retracement, but does not trade on it.

using the same TTF (Daily) as the previous chart but not in Multi Time Frame combo, we can now set parameters to trade same TTF (Daily) and Hedge our exposure in on going Trend based on a HTF (Weekly).
or we can bypass the need for symmetrical exposure within a Synthetic TF, focusing instead on pure asymmetrical trades in a Non Synthetic framework.

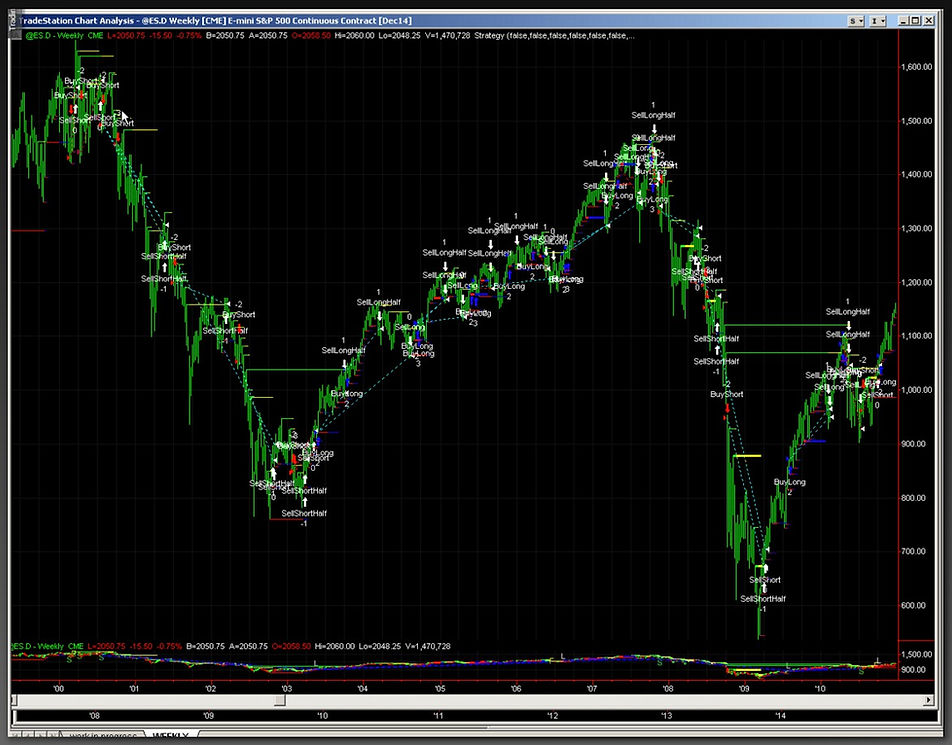
in 2015 long term Trend went Short on a Weekly TTF with a lot of ensuing volatility.
until volatility is over and Structural Synchronization ensues;
using Weekly TF we determine the Primary Structural Trends (three here) and their Encapsulated derivative Trends (Retracements).
drilling down to LTF of a Synthetic TF we Synchronize and obtain more precise Retracements while maintaining HTF’s Primary Structural Trend.

using strictly Daily TTF, the Strategy is set to Hedge any exposed by the HTF open position; simultaneously providing Synchronization among HTF and LTF as well as, a valid Hedge Mechanism when Synchronization is not engaged between TFs.

when not using a Synthetic TF Structure to provide a stable long Term Trend for TTF, we can also use a Hedge between two or more Non Synthetic TFs using a simple HTF/LTF correlation. Here on 10/07 Strategy went Short at the close and on 10/10 at the open we sustained a loss;

running two Strategies on different Non Synthetic TFs at the same time, allows us not only to Hedge the overnight loss but also, to have a powerful Synchronization on 10/11.
SAMPLE 15
SAMPLE 16
SAMPLE 17
SAMPLE 18
SAMPLE 19

usually we use HTF Trend for LTF trades; here is a sample in reverse when LTF can be effectively used for a HTF trades. Here, using the underlying Trend, our Strategy is set for Profit Defined Multiples on a Weekly TTF.

on a LTF (Daily) correlated to HTF Structural Trend (Weekly), we use Retracements, and subsequent Synchronizations, to navigate our HTF Profit Defined open positions.

in this TTF, 2008/2009 presented a loss. Using Synchronization between Non Synthetic TF’s we do not only Hedge our exposure but also, diversify the risk;

creating a Synthetic Framework with the help of a Multi TF construct the Strategy effectively Hedges losses of the correlated pair.
in this set are examples where using multiple LTFs can be an effective Hedge for any HTF turbulence such as in early summer early autumn of 2016.


Structural Transcendency takes place in Aug of 2015 through the Inversion process, resulting in explosive Correction of one of the Hierarchical Structures.

a one dimensional view of Hedging taking place in parallel with Synchronization of the previous chart.

Hedging Mechanism and Synchronization at work.

combined effect of the two charts here is an attempt to show in a very limited way some of the Trends comprising a Multidimensional Structure through a depiction in a one dimensional photo.

here are implicit three Structural Trends in action, Short and Long - Primary Structural, which anchors a Non Synthetic Synchronization (implied), Synchronized Trend and a derivative Primary Trend of the Encapsulated Structure - Retracement, which provides a Hedge - can be seen here working in tandem.
SAMPLE 20
SAMPLE 21

here using Synchronization within a Synthetic TF, we are able to depict and trade on LTF as a TTF, both a Higher Structure Primary Trends in tandem with an Encapsulated Lower Hierarchical Structure Trends - Retracements; signified by SellLongHalf and SellShortHalf.

using a Non Synthetic TF we are able to show an additional number of Trends within Retracements, defined in the previous chart; these Encapsulated Trends through an Inversion, provide a Hedge Mechanism for a higher Structural Primary Trend permeating both charts.

within a Synthetic Framework we are keeping the Structural Primary Trend on a HTF simultaneously identifying Retracements on a LTF;

and using a Non Synthetic Daily TTF to Hedge a chance of any Retracement becoming a Correction.
FOR
EXPERIENCED
An indispensable aid to your own accumulated knowledge of trading the Markets.
-
Ability to conduct quick and comprehensive analyses of appealing Markets; an additional tool and perspective for a fuller multifaceted approach to the Markets and Trading; potential enhancement of your own Trading Methodology, Trading plan and Analytical spectrum.
-
Opportunity to expand and increase your ability to participate in numerous new Markets and Time Frames with fully integrated Analytical and Structural Trading System and its Strategies. Opportunity to implement new Diversification, Synchronization and Hedging techniques either in a single Time Frame and/or independent but correlated Time Frames.
-
Assistance in designing a brand new Trading Methodology and a Trading Plan for your trading Market or a new Market of interest – what Strategies to implement: Day trading or Overnight; Profit Defined or Positional. Based on your specifics, assistance in determining the most optimal Tradable Time Frame or Time Frames and/or combination thereof. Risk Management, as well as assistance in enhancing and expanding your own existing Trading Methodology and Trading Plan to work in tandem with our Structural Methodology and Algorithmic Trading Strategies.
-
For your specific Market of interest we can provide a comprehensive Analytical and Structural Assessment which would include current Multiple Trends for each pertinent Time Frame, Corrections and Retracements for each of the existing Trends, change of Trends and/or their resumption, Strategy generated entry and/or reentry, as well as pertinent exit points and/or partial liquidation of existing positions. Based on your allocated risk and capital parameters selection of the most feasible Tradable Time Frame, Risk Analysis and Management, Assessment of the most effective way to engage the Market through Positional or Profit Defined including Multi Positional trades.
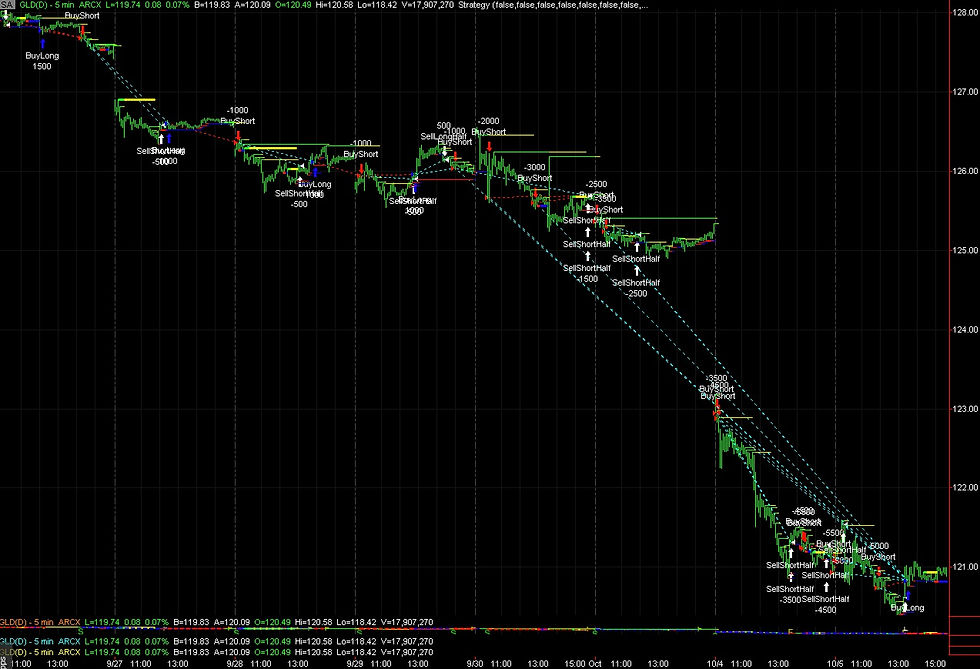
CORRECTIONS

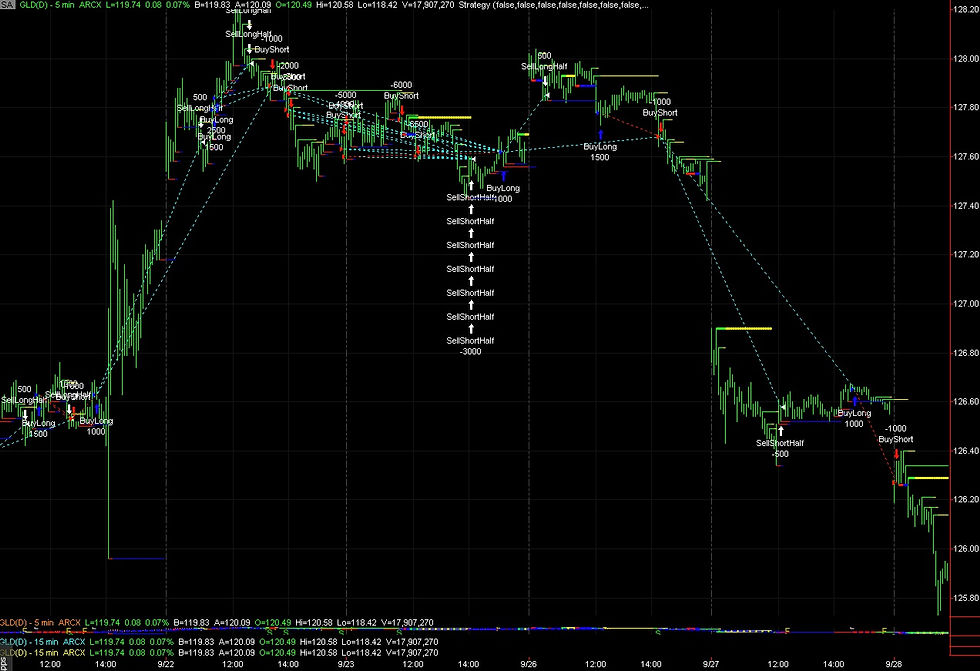
a proprietary indicator (green line) keeps us visually aware of the underlying Primary Trend; while the logic of the Strategy, treats and trades Corrections as independent Trends within a Primary Trend.

Correction is a corrective counter price movement of the Trend to which it belongs. To trade it one has to consider it as a Trend itself. Thus at least two Trends are present at any given time; our Methodology and Algorithm identify and work with up to several independent but related Trends at any given time, on any given TF.

here we have Strategy identifying Retracements (SellLongHalf) and their metamorphosis into Corrections (BuyShort).

sample of how a Retracement sometimes stays a Retracement but at other times becomes a Correction (red line).

one Primary Trend up with many Corrections.

a closer depiction of Corrections on way up and down.

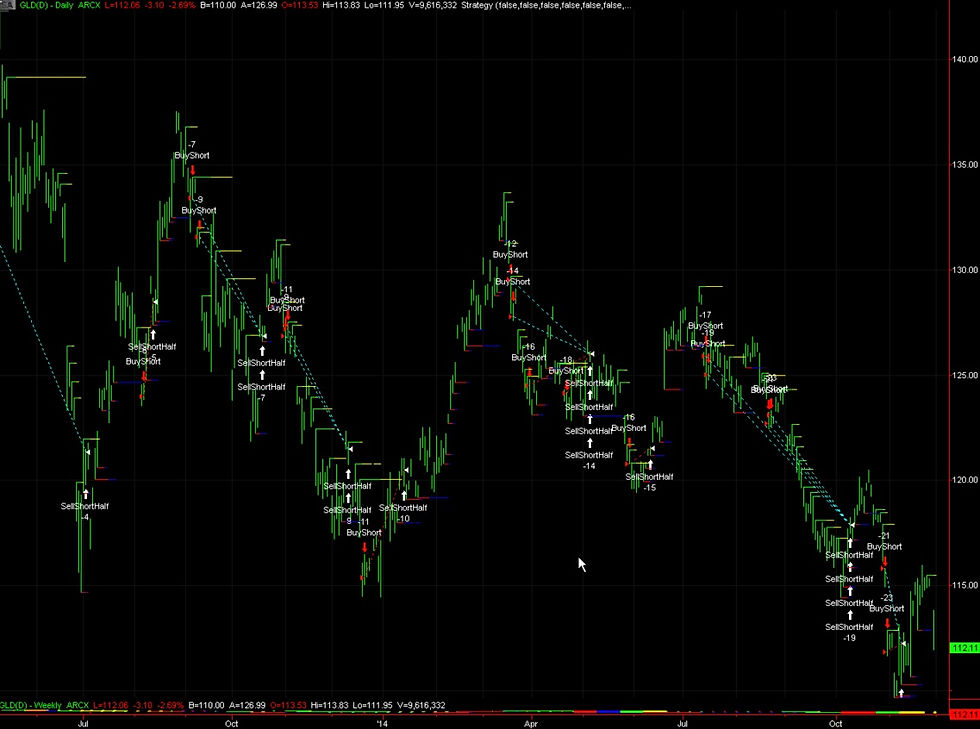
here is bird eye view of 2008 selloff - merely a corrective action of a Long Primary Trend that commenced in 2003 and is still in effect.

2008 sell off traded by the Strategy on a Daily Time Frame; it is both extremely orderly and predictable, with clear identification of Retracements and Corrections.

whereas on Daily Weekly TTF we can maintain the Primary Trend by deferring to HTF and thus trading the pullbacks as Retracements, here the Strategy analyses and works only in one TF and is set to treat and trade pullbacks as Corrections.

a complex Correction with a double bottom and a sideways action on 09/01.

Corrections within a Correction?

whether on Weekly TF or 1min TF, Corrections are ever present and profitable.
Correction up and down again Red Green and Red again using Positional Multiples

on 10/11 at around 3pm accumulation of a Long Positional Multiples - is it a Correction of a prior leg down or beginning of a new Long Trend? The answer is irrelevant as long as you make money and treat it as its own Trend.

example of a case where Correction can be as short as 1 point (1pm) or as long as 10 points (2:30pm).

here Strategy is set to liquidate a position right away in anticipation of Correction without identifying Retracement first.
RETRACEMENTS
Strategy is set not only to identify Primary Trend but also all the Retracements within the ongoing Trend which it identifies by selling half of the current position.

Retracement is simply a pullback within the current Trend it does not change the Trend.

here we have three Trends (not shown) with pertinent to each Retracements (shown).

using a visual aid (red and green lines which Strategy draws in real time) to approximate where a potential Retracement will revert to the ongoing Primary Trend even though not part of Strategies logic it is a useful tool in discretionary trading.

turbulence in the summer of the 2011 was merely a Retracement of the previous leg up even though to many it did not seem that way at the time.

using a HTF and LTF interplay allows us to anticipate Retracements quite effectively with SellLongHalf taking most profits off the table and BuyLong providing the most optimal re entry point into the Primary Trend.

few Retracements in a multi year Trend up including 2015/2016.

here Strategy is set to identify the Primary Trend down (not shown); beginning of Retracement - pullback against the Trend (SellShortHalf); end of Retracement and Synchronization with the Primary Trend (BuyShort).

after the Trend down is over, new Trend up has started with the two Retracements clearly shown and beginning of the third (right side of the chart).

minor and major Retracements over the years are identified and traded with good precision while maintaining an overall Long Primary Trend intact.

when Retracement is identified and the signal is given (SellLongHalf) to automatically sell half of the existing Long position while keeping the other half Long; we can do that and run the risk of Retracement becoming a Correction, or we can just sell the entire position and use the Strategy signal to reenter (Synchronization) to establish a new position.

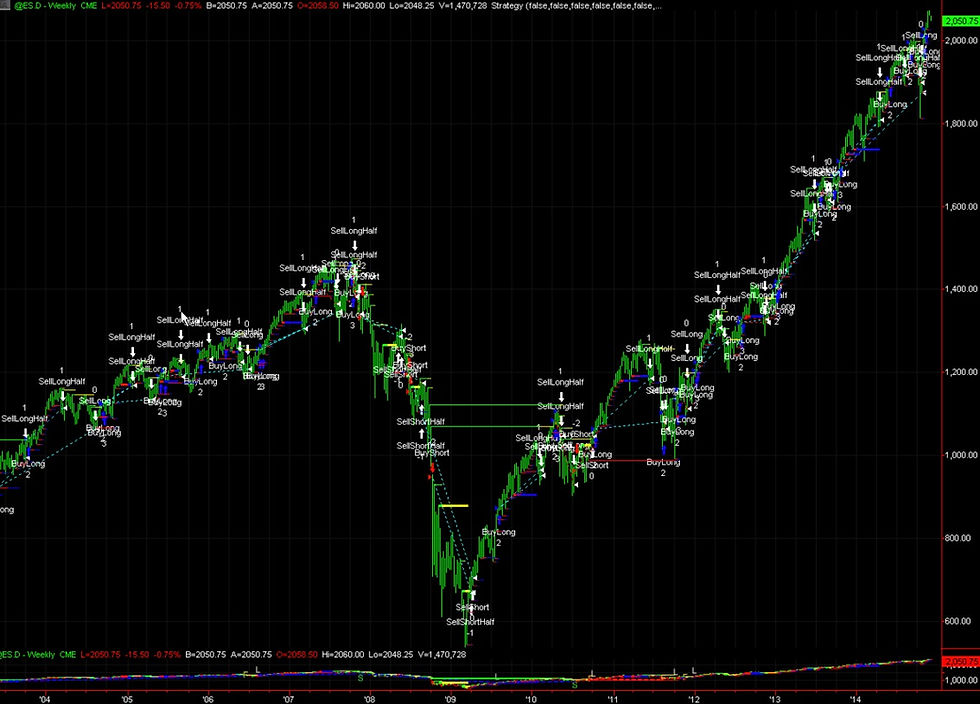
a great example of how the Strategy forewarned the Black Monday in 1987 by giving us the signal of impending Retracement before the infamous drop.

since most of Corrections start off as simple Retracements a special attention should be paid to such signals. Here is another great example in 2008 even though the TTF kept the Trend intact the severity of the Retracement realistically could not have been withstood.

using HTF Strategy keeps Primary Trend Long while on TTF (Daily), it identifies and trades Retracements by selling half the position and then adding to the remaining half of the position after Retracement is over.

using HTF and LTF (TTF) to effectively trade the Retracements throughout a multi year Primary Long Trend.

While Primary Trend is Long we SellLongHalf before Retracement and BuyLong to Synchronize with the Trend. When Trend has changed to Short, we BuyShort then SellShortHalf before its own Retracement with subsequent Synchronization of the Short Trend depicted by the Strategy as BuyShort. Third Primary Trend here is Long again with a couple of its own Retracements.
TRENDS

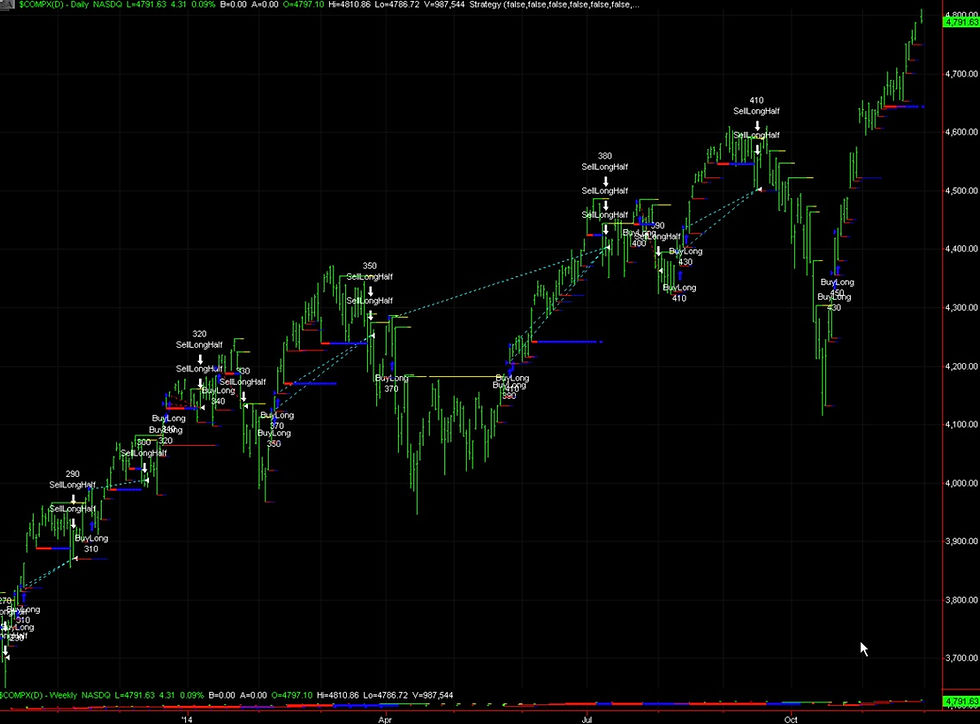
while Primary Trend is up strategy takes only Long Positional Multiples.

Strategy is set to identify Primary Trends only.

while identifying a Primary Trend (Green Line) Strategy is set to trade both Short and Long within the Primary Trend.

while identifying Primary Trends (Red and Green Lines) Strategy is set to trade both Short and Long within the Trends.

while identifying a Primary Trend (Green Line) Strategy is set to trade both Short and Long Positional Multiples within the Primary Trend.
while Primary Trend is up Strategy takes only Long Positional Multiples.

Strategy is set to identify Primary Trends only.

while identifying Primary Trend (Green Line) Strategy takes only Long positions selling half position before Retracement and buying back when Primary Trend resumes.

Strategy is set to identify Primary Trends only.

Strategy is set to identify Primary Trends only.

Strategy is set to identify Primary Trends only.

while identifying a Primary Trend (Green Line) Strategy takes only Long positions selling half position before Retracement and buying back when Major Trend resumes.

while identifying a Primary Trend Strategy takes only Long positions selling half position before Retracement and buying back when Primary Trend resumes.

sample of four Primary Trends with Positional trades.

sample of four Primary Trends with Positional Multiples.

while identifying Primary Trend Strategy takes only Short positions selling half position before Retracement and buying back when Primary Trend resumes.
PRICE
$99/week
$199/week
$499/week
FAQ
Can you provide the insight into your Trading Methodology and the terms you use?
Please, refer to our Glossary and White Paper.
Is the Strategy fully Automated?
The signals the Strategy produces are completely automated, but the trading should be done on a manual basis since we are not CTA’s and do not manage or trade client’s funds.
How does one receive access to your System?
We provide access to our System and its Strategies through web conferencing and webinar software. Every day you will be sent an id number to join our “Online Traderoom” prior to the Market’s open. Thus, you will be able to see our Strategies work live on the Markets and Time Frames tailored to your specific requests.
Do you provide any additional training as to the use of the System and/or basic Market understanding aside from Auto generated signals?
A one-on-one training session is available upon request to explore more advanced Trading and Market concepts for an additional cost.
Do you guarantee I will make money every month?
No we do not. We provide trading ideas only for educational purposes. Nothing from this site should be considered as investment advice. As per the required CFTC Risk Disclosure statement guidelines we cannot provide guarantees regarding future performance. Please read the CFTC Risk Disclosure statement on this website. Futures trading involves risk. There is a risk of loss in Commodity Futures trading.
Do you have to be registered as a CTA in order to lease your System?
No, we do not. Pursuant to CFTC Rule 4.14(a)(9)(ii), we are not required to register under the Act as a commodity trading advisor.
A person is exempt from registration as a CTA if “[i]t does not engage in . . . [p]roviding commodity trading advice based on, or tailored to, the commodity interest or cash market positions or other circumstances or characteristics of particular clients.”
What is your refund policy?
We do not provide a refund. Your contract with us is on weekly basis only and has to be renewed every week or be prepaid for any number of weeks you like.
If one has additional questions after leasing the System, will you be available to answer them?
As a general rule, our work speaks for itself and is self explanatory. After initial consultation and training in your specific Market, Time Frame and set of parameters pertinent to your trading style we will not be available for day to day Market Analysis, performance review, etc. However, if you need to change a Market or Time Frames we will be there to accommodate you.
Are your results based on live trading or simulated?
Results are based on simulated or hypothetical performance and as such these results have certain inherent limitations. Unlike the results shown in an actual performance record, these results do not represent actual trading. Simulated or hypothetical trading programs in general are also subject to the fact that they are designed with the benefit of hindsight. No representation is being made that any account will, or is likely to, achieve profits or losses similar to those being shown. We also cannot guarantee that you will strictly follow the Strategies’ signals.
Do you have a Strategy available for broker assisted?
No, the Strategy is not available for Broker assisted.
By using the TRADEforDOLLAR.com website, products, and services, you fully understand and agree to legally comply with this Risk Disclosure, Disclaimer statements, Lease Agreement and our Terms and Conditions.
Through the use of the TRADEforDOLLAR.com website, you are hereby accepting the terms and conditions stipulated within the aforementioned Disclosures, Disclaimers, Agreements and Terms and Conditions. If you are not in agreement with the TRADEforDOLLAR.com terms and conditions, then you should refrain from further use of this site. In addition, your continued use of the TRADEforDOLLAR.com website following the posting of any updates or changes to our terms and conditions shall mean that you are in agreement and acceptance of such changes.
Futures’ trading contains substantial risk and is not for every investor. An investor could potentially lose all or more than the initial investment. Risk capital is money that can be lost without jeopardizing one's financial security or life style. Only risk capital should be used for trading and only those with sufficient risk capital should consider trading. Past performance is not necessarily indicative of future results.
U.S. Government Required Disclaimer - Commodity Futures Trading Commission. Futures and options trading have large potential rewards, but also large potential risk. You must be aware of the risks and be willing to accept them in order to invest in the futures and options markets. Don't trade with money you can't afford to lose. This website is neither a solicitation nor an offer to Buy/Sell futures or options. No representation is being made that any account will or is likely to achieve profits or losses similar to those discussed on this website. The past performance of any trading system or methodology is not necessarily indicative of future results. You could risk all your money.
NFA required disclaimer:
Hypothetical performance results have many inherent limitations, some of which are described below. No representation is being made that any account will or is likely to achieve profits or losses similar to those shown. In fact, there are frequently sharp differences between hypothetical performance results and the actual results subsequently achieved by any particular trading program.
One of the limitations of hypothetical performance results is that they are generally prepared with the benefit of hindsight. In addition, hypothetical trading does not involve financial risk, and no hypothetical trading record can completely account for the impact of financial risk in actual trading. For example, the ability to withstand losses or adhere to a particular trading program in spite of trading losses are material points which can also adversely affect actual trading results. There are numerous other factors related to the markets in general or to the implementation of any specific trading program which cannot be fully accounted for in the preparation of hypothetical performance results and all of which can adversely affect actual trading results.
CFTC rule 4.41 - hypothetical or simulated performance results have certain limitations. Unlike an actual performance record, simulated results do not represent actual trading. Also, since the trades have not been executed, the results may have under-or-over compensated for the impact, if any, of certain market factors, such as lack of liquidity. Simulated trading programs in general are also subject to the fact that they are designed with the benefit of hindsight. No representation is being made that any account will or is likely to achieve profit or losses similar to those shown.